Home · SEO · Web Development
Introducing the Reputifly ROAS Scenario Lab: Model Profit, ROAS & Break-Even in Minutes
Reading time: 10–12 minutes · Updated 2025
What the Lab is (and who it’s for)
Reputifly ROAS Scenario Lab is a browser-based planning tool for performance marketers, founders and growth teams who need to answer questions like “What spend makes sense?”, “Where is the bottleneck?”, and “What happens if CPC rises 10%?”—without touching a spreadsheet.
It’s perfect for enquiry-led businesses (clinics, legal, home services, B2B) and lean e-commerce where every click must pull its weight.
Why this matters to web & SEO decisions
Design & copy budgets with a profit lens
When your site and SEO work lift CVR and Closing Rate, the Lab shows how that compounds into Profit/Day and ROAS. You’ll know whether to invest in faster pages, better service pages, or follow-up automation.
Replace “best guess” with scenario proofs
Create Worst, Realistic and Best cases, then share the chart. Stakeholders see the same curve, not competing opinions.
Want a site & SEO stack engineered around this model? Explore Web Development and SEO Services.
How the Lab works: a quick tour
1) Side-by-side scenarios
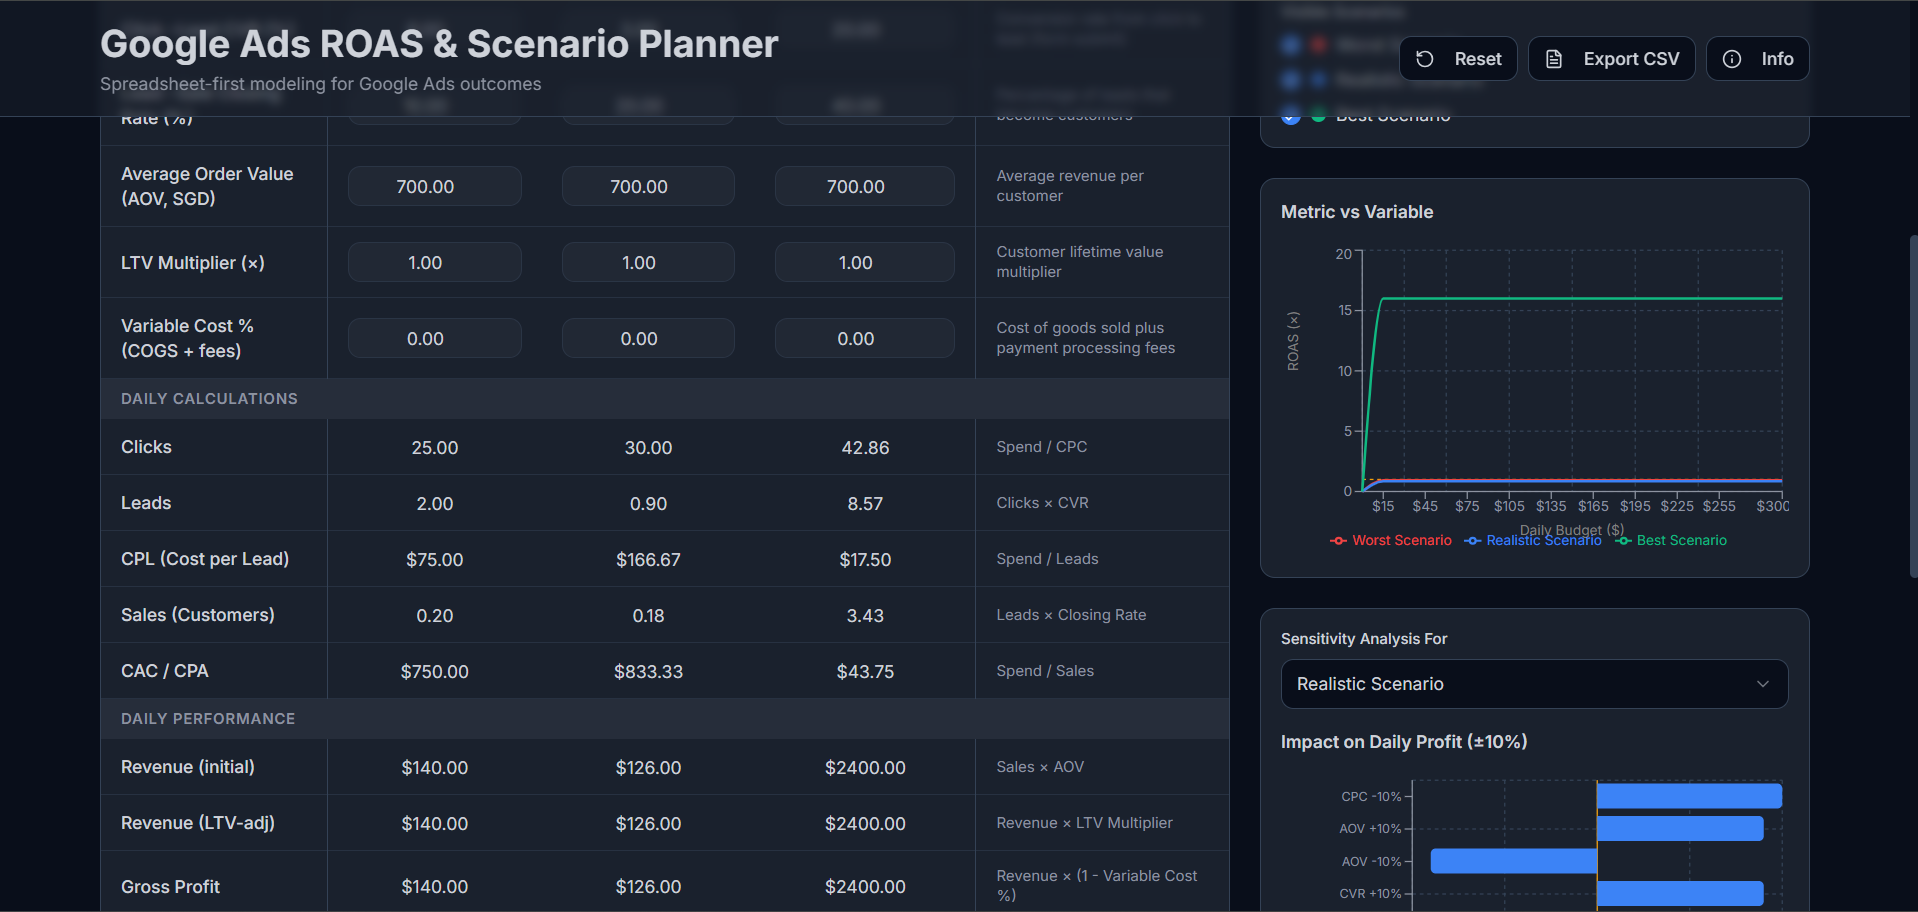
A sticky, editable table lets you set campaign inputs—Spend, CPC, Click→Lead CVR, Closing Rate, AOV, LTV Multiplier and Variable Cost %—and instantly calculates clicks, CPL, CAC, revenue, profit and ROAS. Tooltips explain every metric.
Under the hood, your inputs persist in localStorage, so your work is waiting when you return.
2) KPI badges at a glance
Colour-coded Profit/Day, ROAS, CAC and CPL badges sit above the table so you can sanity-check outcomes before you even open a chart.
3) Metric vs. Variable chart
Pick any X (e.g., Spend or CPC) and Y (Profit, ROAS, CAC, CPL). The lines show how each scenario behaves across a sweep, with annotated reference lines (Profit = 0 or ROAS = ×1.00) so you can see break-even points instantly.
Built with Chart.js + annotation plugin for crisp, fast visuals.
4) Sensitivity analysis (±10%)
A “tornado” style bar chart ranks which lever (Budget, CPC, CVR, Closing, AOV) moves profit the most in your chosen scenario—perfect for prioritising work. If CVR dominates, you know to fix UX and forms before buying more clicks.
5) Break-even thresholds
The Lab computes Break-Even CPC, Break-Even CVR and Break-Even Close so you can negotiate bids, landing-page targets and sales expectations with reality checks built in.
6) Practical extras
- Export charts (PNG) & data (CSV) for decks.
- Reset to a known baseline anytime.
- Info modal with glossary + formulas.
- Self-test runs at load to verify math, and a banner warns you if anything is off.
A 10-minute decision playbook
- Duplicate “Realistic” to match your current account numbers.
- Set a speed budget for your site and update CVR assumptions based on expected gains (faster pages → higher conversions).
- Use the X/Y chart with X = Spend, Y = Profit to find your diminishing-returns elbow.
- Flip to sensitivity and prioritise the top two profit levers for your next sprint.
- Share the PNG with your team and align on targets you can actually defend.
Need help turning this into a roadmap? Build with Reputifly and pair it with SEO that compounds.
Inside the math
Core flow
Clicks= Spend / CPCLeads= Clicks × CVRSales= Leads × CloseRevenue= Sales × AOV × LTV
Profit & efficiency
Gross= Revenue × (1 − Variable Cost%)Profit/Day= Gross − SpendROAS= Revenue / SpendCAC= Spend / Sales,CPL= Spend / Leads
The production tool also rolls monthly totals (×30) and computes break-even CPC, CVR and Close so you can set guardrails during optimisation.
Try it: Mini ROAS Estimator
Play with the inputs. The math updates instantly.
Profit/Day: $0.00 · ROAS: ×0.00 · CAC: $0.00 · CPL: $0.00
Break-Even CPC: $0.00 · Break-Even CVR: 0.00% · Break-Even Close: 0.00%
FAQs
Is the Lab a replacement for spreadsheets?
For scenario planning and stakeholder alignment—yes. For deep financial modelling—use both. The Lab’s goal is speed, clarity and consistent assumptions.
Does it work for e-commerce and lead-gen?
Yes. The math is channel-agnostic. Swap “AOV” for “Average Sale Value” in lead-gen and keep LTV × Variable Cost% realistic for your margins.
Can I export my data and charts?
Yes. One click exports CSV (table) and PNG (chart) so you can drop them into decks or share with your team.
What if my CPC or CVR fluctuates a lot?
That’s why scenarios exist. Model a range and use sensitivity analysis to see which lever deserves attention first.